
July
29th,
2014
This is an university project develop for the course Information Visualization.
The purpose of this project is to visualize the bitcoin’s miners interactions. A miner is a particular user who collaborate in the building of bitcoin blockchain.
To do this we chose to develope two types of visualization, due to the different time range considered.
Both of them are represented by a graph view, in particular:
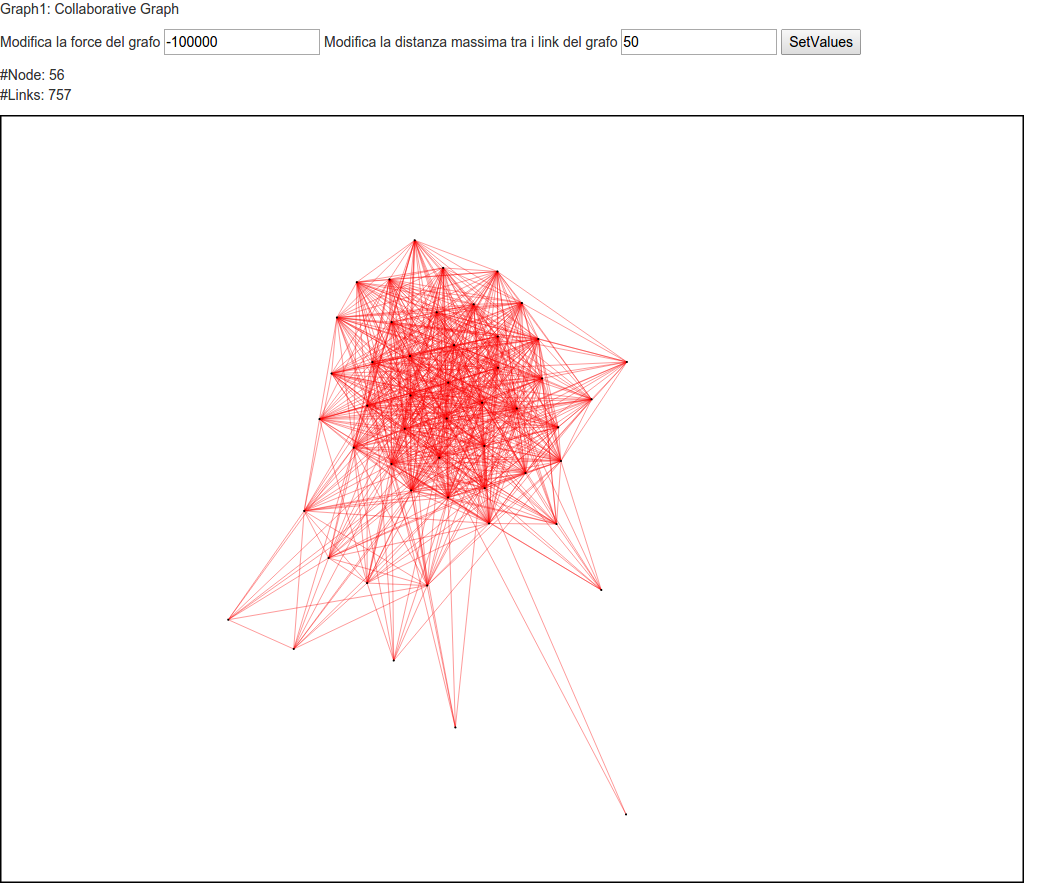
- macro-level interaction: it's possible to view the interactions between miners over the time. In particular it is possible to view miners that collaborated in the same blocks. So a node indicates a miner and a link means a collaboration between two miners.
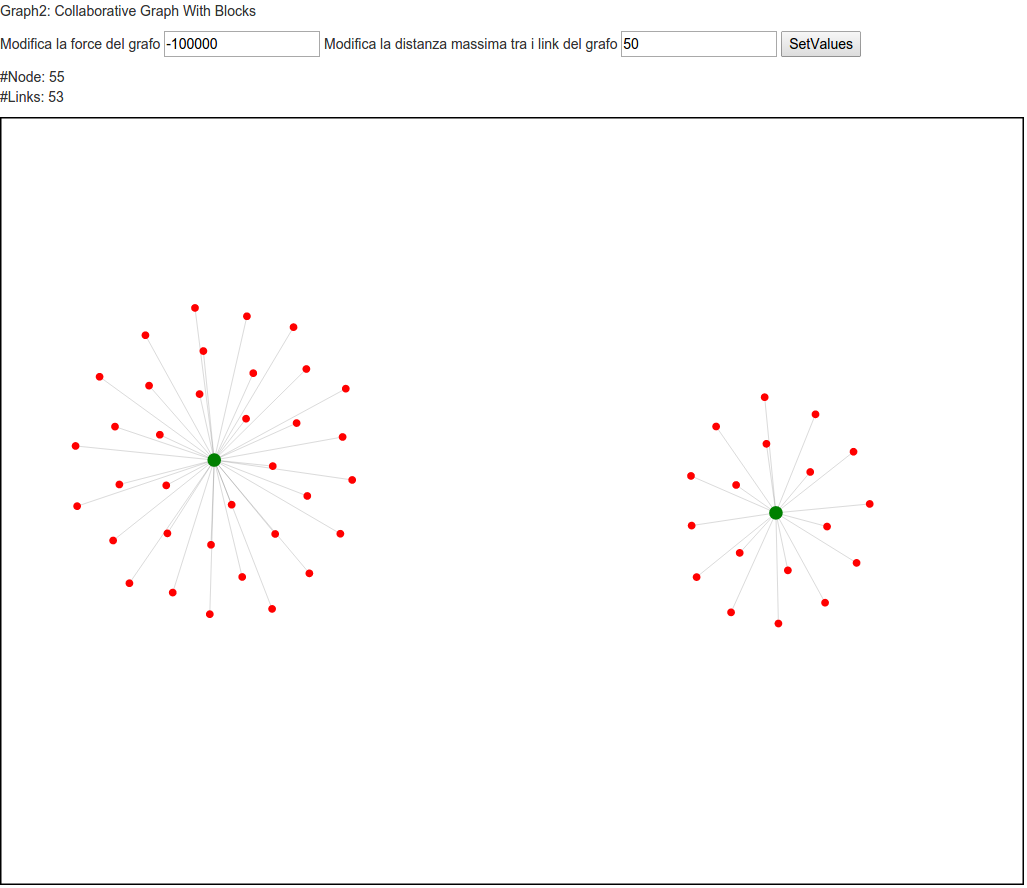
- micro-level interaction: it's possible to view which blocks are mined by a miner. In this chart there are two types of node: the red one indicates a miner and the green one a block. A link between them indicates that the particular miner mined that block.
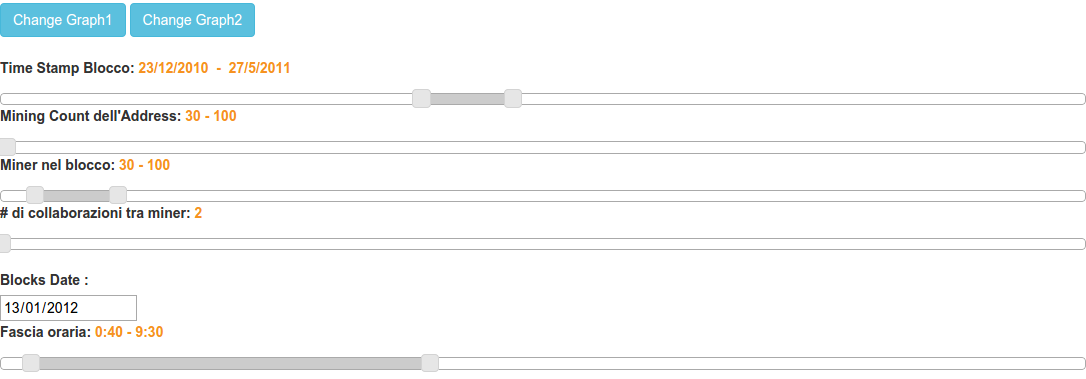
Also we provided five filters to reduce the huge amount of informations.
The project is dived into two foldier:
- Preprocessing: a parser of bitcoind's data written in Python. This module read the entire database and persist the filtered information into our mongoDB database.
- Visualization: a web-app that provide the visualization service described before.
More detailed information about the project can be found on this paper (located in italian)
Macro-level
Micro-level
Filters
- information visualization ,
- bitcoin ,
- python ,
- d3.js ,
- node.js ,
- web-app ,
- big data ,
- mongoDB